grafana
Grafana allows you to query, visualize, alert on and understand your metrics no matter where they are stored. Create, explore, and share dashboards with your team and foster a data-driven culture:
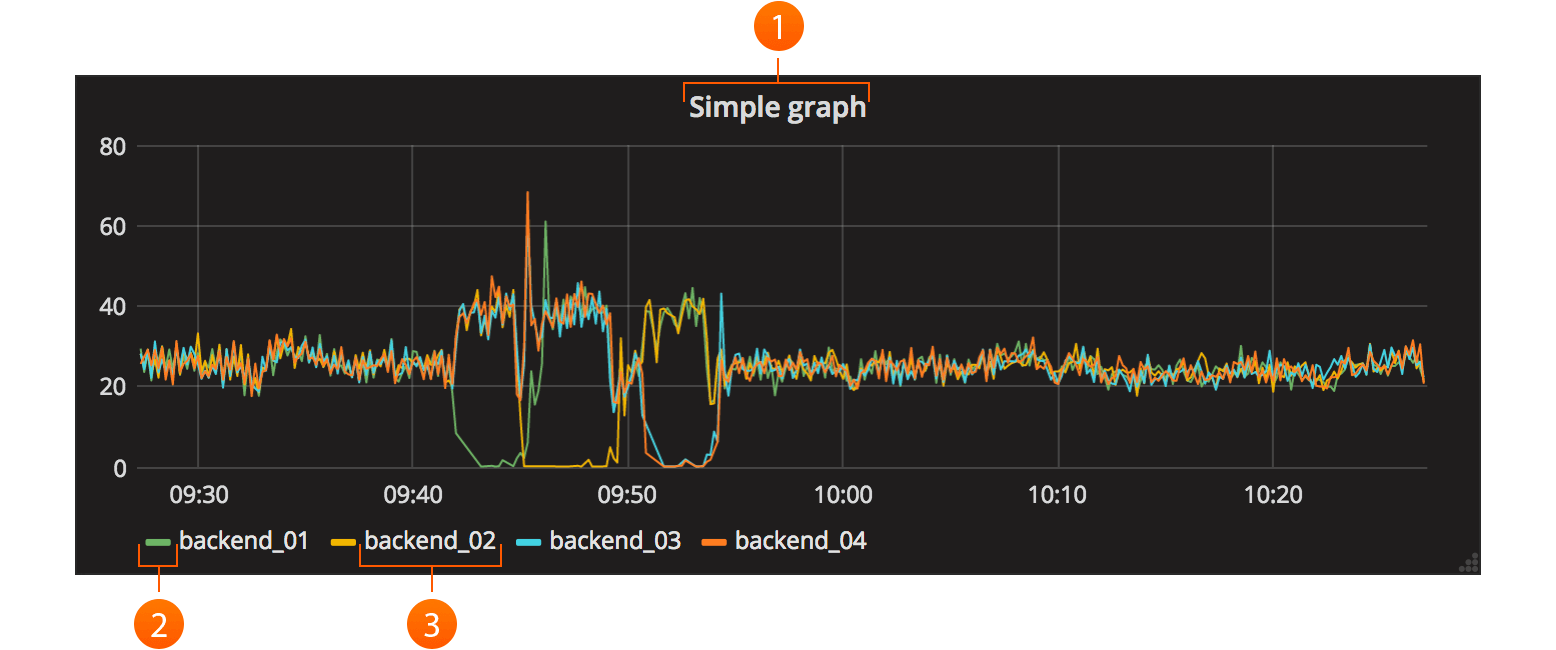
- Visualize: Fast and flexible client-side graphs with a multitude of options. Panel plugins for many different ways to visualize metrics and logs.
- Dynamic Dashboards: Create dynamic & reusable dashboards with template variables that appear as dropdowns at the top of the dashboard.
- Explore Metrics: Explore your data through ad-hoc queries and dynamic drilldown. Split view and compare different time ranges, queries and data sources side by side.
- Explore Logs: Experience the magic of switching from metrics to logs with preserved label filters. Quickly search through all your logs or streaming them live.
- Alerting: Visually define alert rules for your most important metrics. Grafana will continuously evaluate and send notifications to systems like Slack, PagerDuty, VictorOps, OpsGenie.
- Mixed Data Sources: Mix different data sources in the same graph! You can specify a data source on a per-query basis. This works for even custom datasources.
Changelog v6.5.0
Features / Enhancements
- CloudWatch: Add curated dashboards for most popular amazon services. #20486, @sunker
- CloudWatch: Enable Min time interval. #20260, @mtanda
- Explore: UI improvements for log details. #20485, @ivanahuckova
- Server: Improve grafana-server diagnostics configuration for profiling and tracing. #20593, @papagian
Bug Fixes
- BarGauge/Gauge: Add back missing title option field display options. #20616, @torkelo
- CloudWatch: Fix high CPU load. #20579, @marefr
- CloudWatch: Fix high resolution mode without expression. #20459, @mtanda
- CloudWatch: Make sure period variable is being interpreted correctly. #20447, @sunker
- CloudWatch: Remove HighResolution toggle since it’s not being used. #20440, @sunker
- Cloudwatch: Fix LaunchTime attribute tag bug. #20237, @sunker
- Data links: Fix URL field turns read-only for graph panels. #20381, @dprokop
- Explore: Keep logQL filters when selecting labels in log row details. #20570, @ivanahuckova
- MySQL: Fix TLS auth settings in config page. #20501, @peterholmberg
- Provisioning: Fix unmarshaling nested jsonData values. #20399, @aocenas
- Server: Should fail when server is unable to bind port. #20409, @aknuds1
- Templating: Prevents crash when $__searchFilter is not a string. #20526, @hugohaggmark
- TextPanel: Fixes issue with template variable value not properly html escaped #20588, @torkelo
- TimePicker: Should update after location change. #20466, @torkelo
Breaking changes
- CloudWatch: Pre Grafana 6.5.0, the CloudWatch datasource used the GetMetricStatistics API for all queries that did not have an ´id´ and did not have an ´expression´ defined in the query editor. The GetMetricStatistics API has a limit of 400 transactions per second. In this release, all queries use the GetMetricData API. The GetMetricData API has a limit of 50 transactions per second and 100 metrics per transaction. Also the GetMetricData API pricing is different from GetMetricStatistics. While GetMetricStatistics qualified for the CloudWatch API free tier, this is not the case for GetMetricData calls. For more information, please refer to the CloudWatch pricing page (https://aws.amazon.com/cloudwatch/pricing/). Read more about GetMetricData limits in upgrading to 6.5.
- CloudWatch: The GetMetricData API does not return metric unit, so unit auto detection in panels is no longer supported.
-
CloudWatch: The
HighResswitch has been removed from the query editor. Read more about this in upgrading to 6.5. - CloudWatch: In previous versions of Grafana, there was partial support for using multi template variables as dimension values. When a multi template variable is being used for dimension values in Grafana 6.5, a search expression will be generated. In the GetMetricData API, expressions are limited to 1024 characters, so it might be the case that this limit is reached when a multi template variable that has a lot of values is being used. Read about the suggested workaround in upgrading to 6.5.
Download && Use
Copyright 2015 Grafana Labs
![]()
![]()
![]()
![]()
The post grafana v6.5.0 releases: open-source platform for monitoring and observability appeared first on Penetration Testing.