In this post, Matías Porolli looks at how to configure an environment with WinDbg and virtual machines in order to debug drivers or code running in Windows kernel space.
On various occasions, I’ve received inquiries about how to install and start using WinDbg. For this reason, in this post, I’m going to show you how to configure an environment with WinDbg and virtual machines in order to debug drivers or code running in Windows kernel space.
In this example, I’m going to use my host machine with Windows 10 to carry out debugging on virtual machines running under VMWare. It is also possible to use a virtual machine as the debugger and a second machine as the target, but we’re not going to cover that example in this post today.
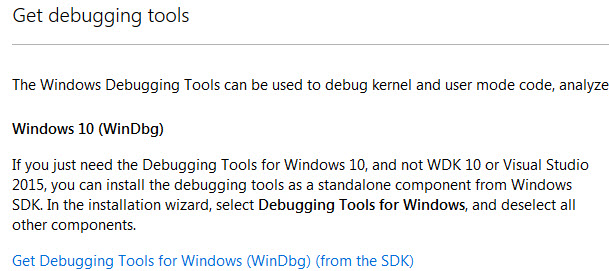
The first step is to download the WinDbg installation, which can be done here. We’re going to select the installation of debugging tools so as not to download other features that we don’t need:
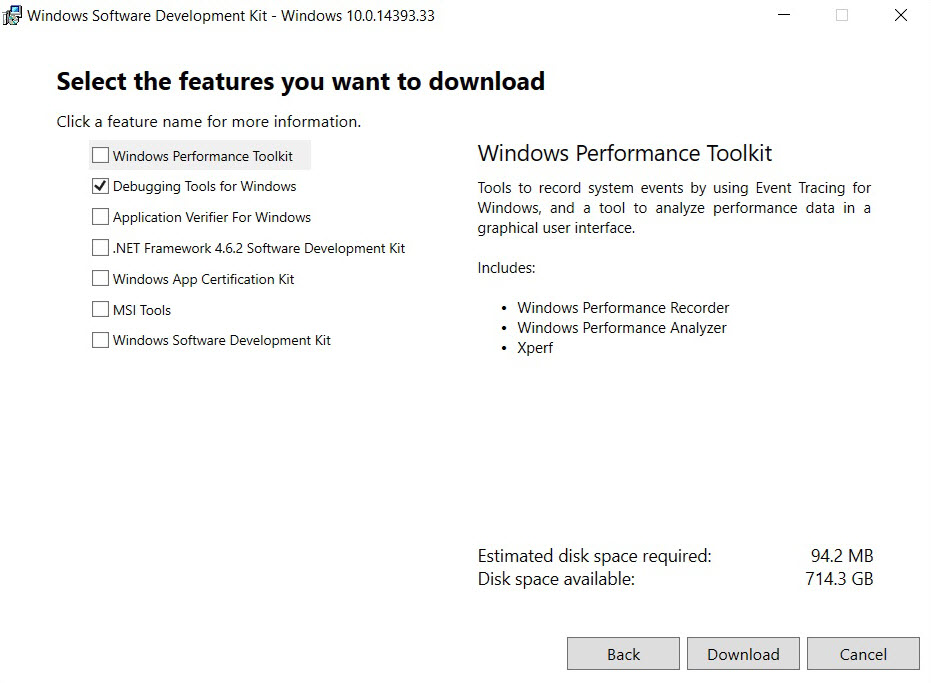
After downloading it, run setup. Depending on how up to date the host is, it may be necessary to download some .NET Framework packets or Windows updates. In the installation, select “Debugging Tools”:
Once installed, we’re now going to turn our attention to configuring the virtual machines that are going to be debugged. The first step is to generate an entry in the boot table with debugging options activated. To do that, we’re going to take a guest machine with Windows 7 that has the bcdedit command to perform these tasks.
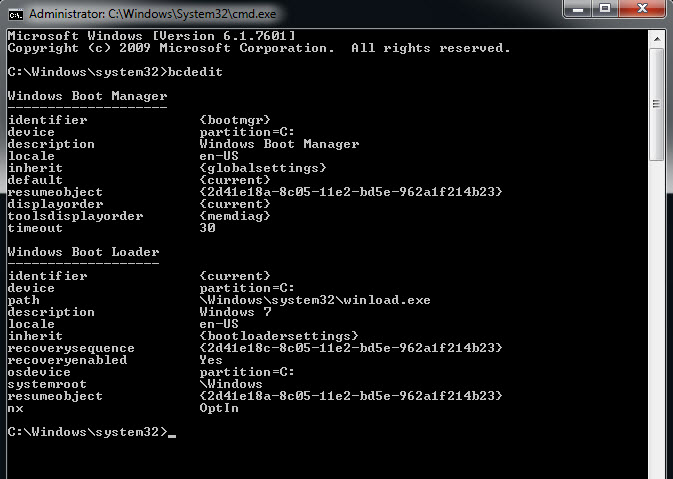
Running the command without parameters shows us the configuration of the boot manager and each of the entries in the boot table (initially there is just one entry). Then, the simplest way to generate a new entry with debugging enabled is to copy the first entry and change it:
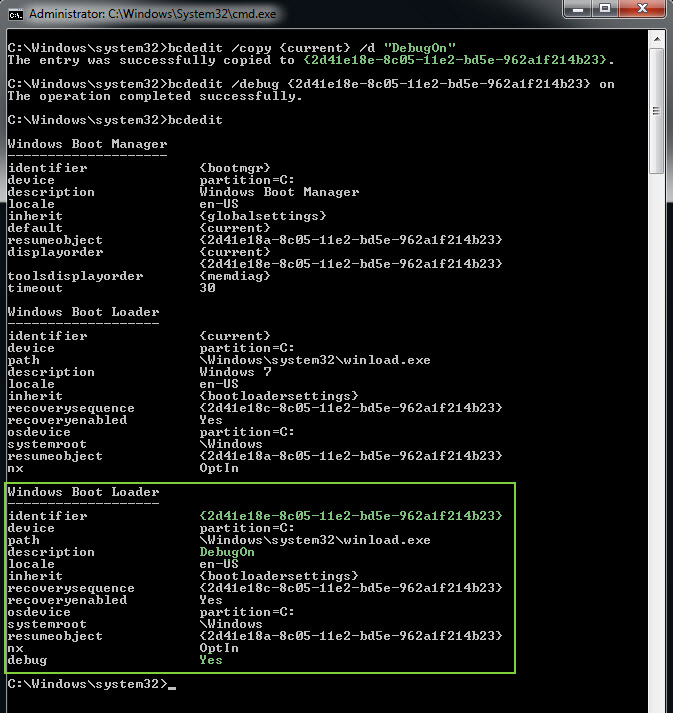
After making the copy, which has been named “Activated Debug,” the debug mode is enabled. If we now view the entries in the table, we see that a new one has appeared. Finally, the bcdedit command can also be used to configure the communication between the host with WinDbg and the virtual machine. I’ll also show you another way of doing it: if you press the “Win+R” key combination on your virtual machine and type “msconfig” in the dialog box, you will access certain Windows startup configurations. In the “Startup” tab, you will be able to edit the advanced options, as seen in the following image:
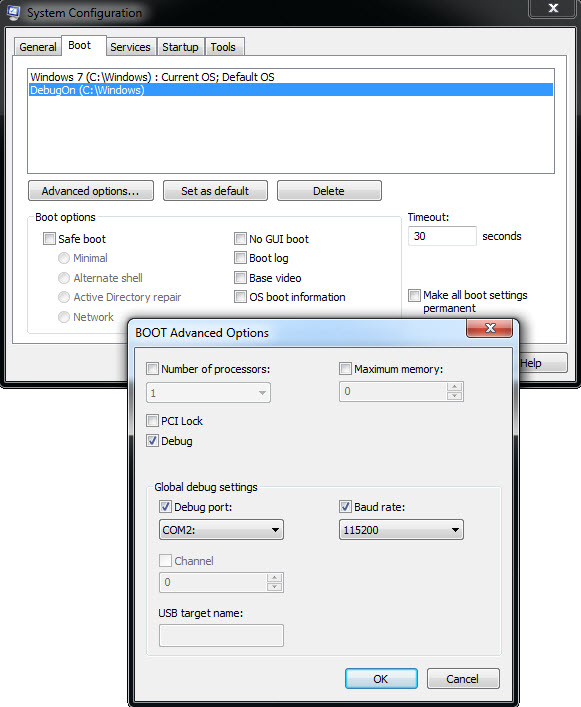
Our host and the virtual machine will communicate through the COM2 serial port (or the one that we choose) synchronized at a baud rate of 115200. I recommend that you don’t change the baud rate, but, instead, use the COM2 port instead of COM1. Given that it is highly likely that the virtual machine does not have a serial port, we need to add one. For VMWare, it can be done in configuration:

Choose the options as shown in the image. It is important to give it the name that appears: “\.pipecom_2”. Everything is now configured and the next step is to restart the VM and boot up in debug mode:

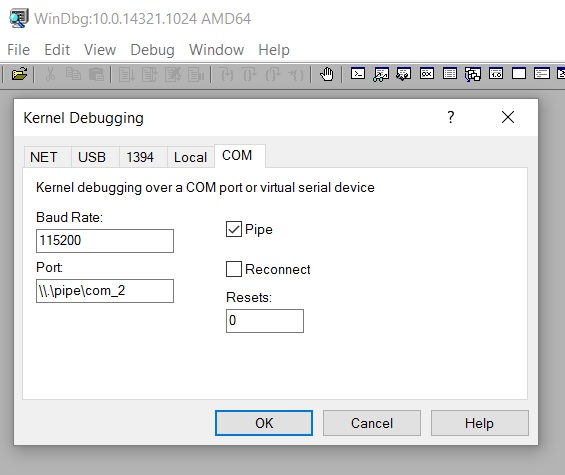
Once the option is selected, there should be no difference in system startup. On the desktop, we can save a snapshot of the VM or prepare the environment that we wish to debug. When we’re ready, go to the host and open WinDbg to start the debugging session. From the “File” menu select “Kernel Debugging,” and on the COM tab fill it in as shown in the image below:
When we hit “OK,” WinDbg will be connected, but we won’t be able to interact with the virtual machine until we stop it running at an instruction. To do that, press “Ctrl+Pause” (or “Debug>Break” menu). If we go to the virtual machine, we can now see that it is frozen and we cannot move the mouse or obtain a response from the keyboard. This is normal, given that the VM is stopped at an instruction. On the host side, we will see something similar to this:
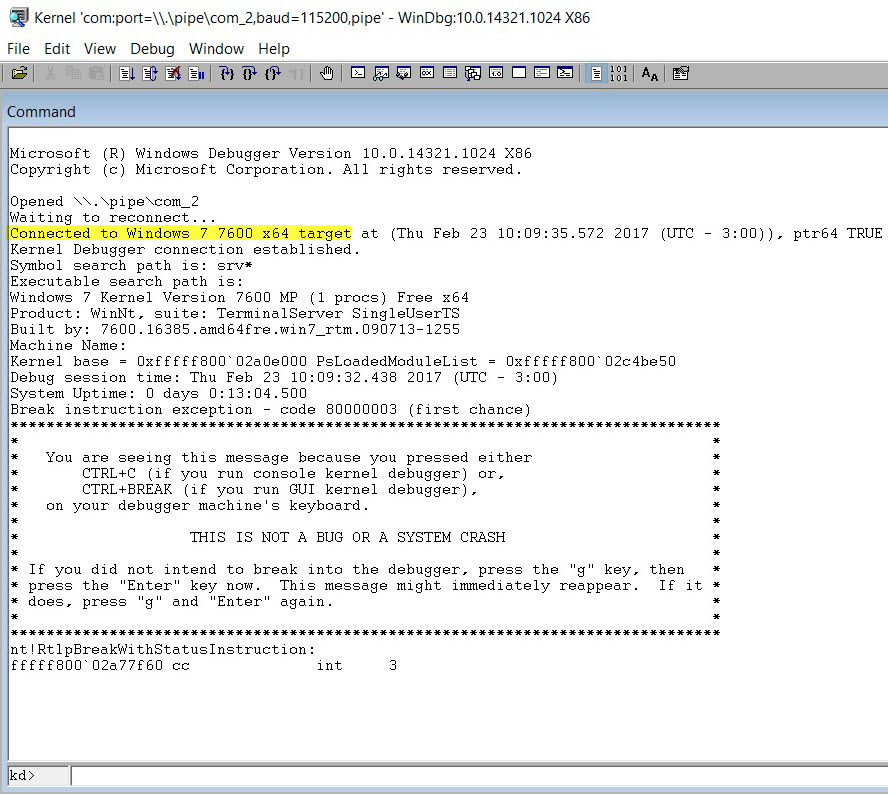
From the last line, we can see that execution of the instruction has been stopped by using an int 3, which has been stopped in the kernel’s memory, and that the address line is 64-bit. Below that is the console with which we can start to send commands to WinDbg.
Windows XP
If we need to debug a virtual machine with WinXP, all the steps are the same with the exception of the boot configuration. Instead of bcdedit (which is not available in Windows XP), we manually edit the “C:boot.ini” file. This file is hidden, so we may need to change the folder options so that it shows us hidden files and so that system protected files are not hidden.

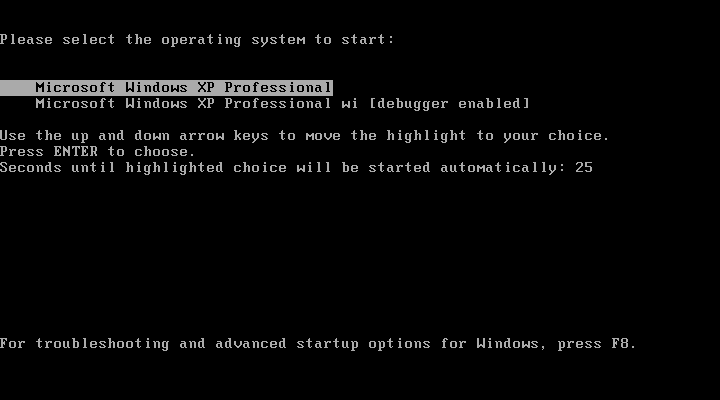
Next, we copy the first entry, (which then appears as “[operating systems]”), change the name so as not to confuse it with the other one and add the debug options. You just need to save the file and restart the system to see the new boot options:
By following these steps, you will be able to use the debugging tools in the Windows kernel space without any problems. What are you waiting for to test this process?
Photo credits: ©Michael Hicks/Flickr